Performance
CEO & Chairman's review
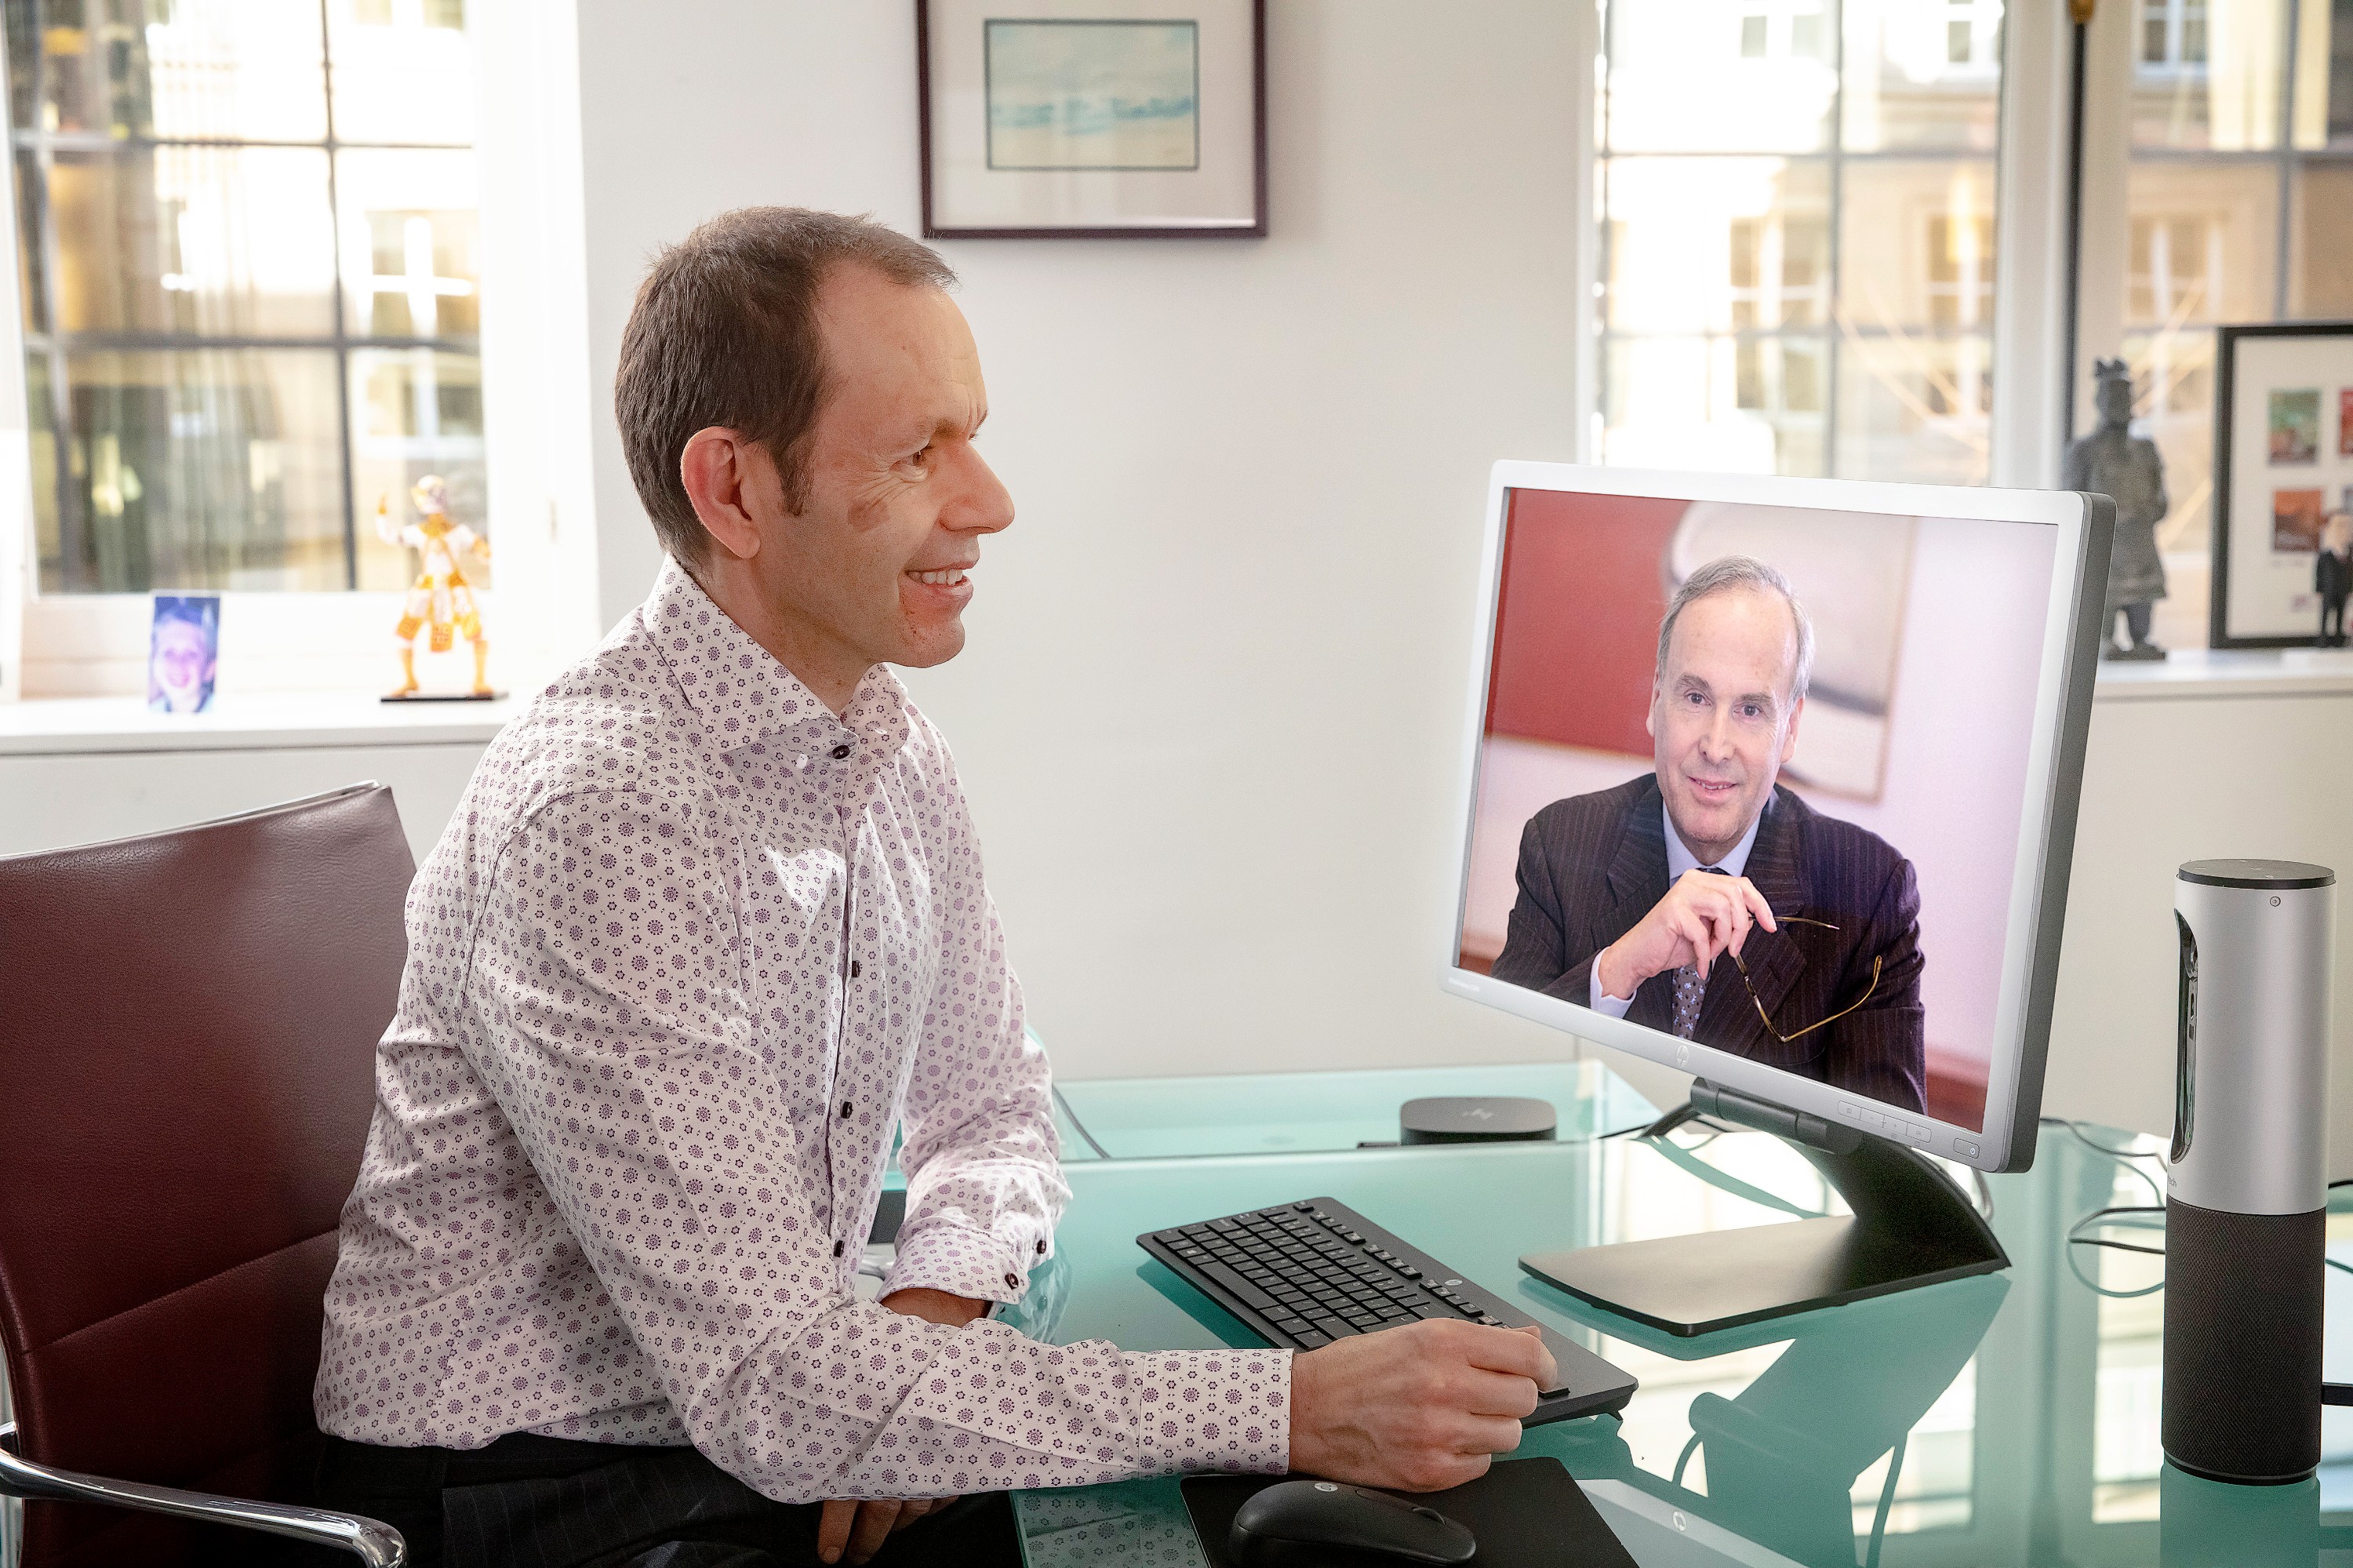
"The pandemic outbreak in 2020 brought sudden challenges to our living and working environment. Our priority was immediately the wellbeing of our employees and the communities in which we operate. We would like to thank Umicore employees for their spirit, solidarity and strength during the pandemic. We would also like to express our gratitude to all the Umicore medical staff and employees who worked hard under difficult circumstances to make sure we could be safe, first and foremost, and keep our operations up and running.The challenge has been tremendous and the effort to get through these times has been very demanding."
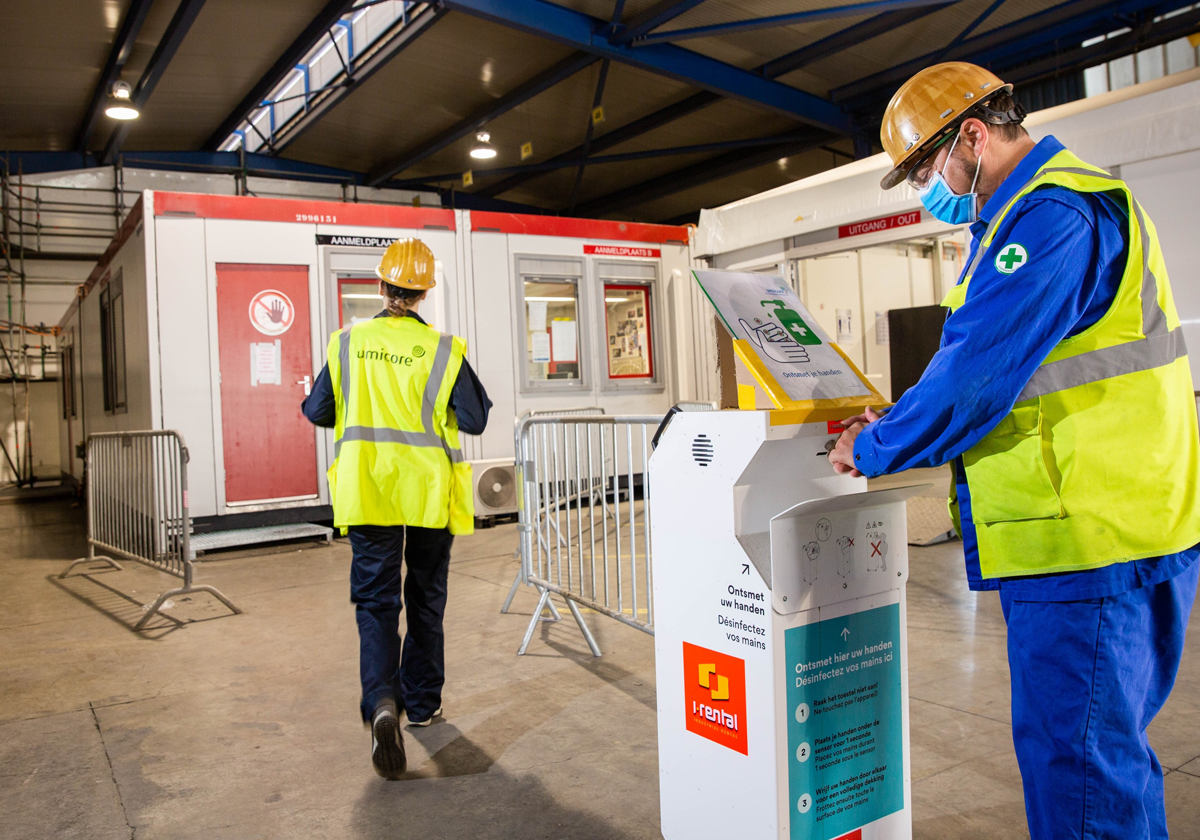
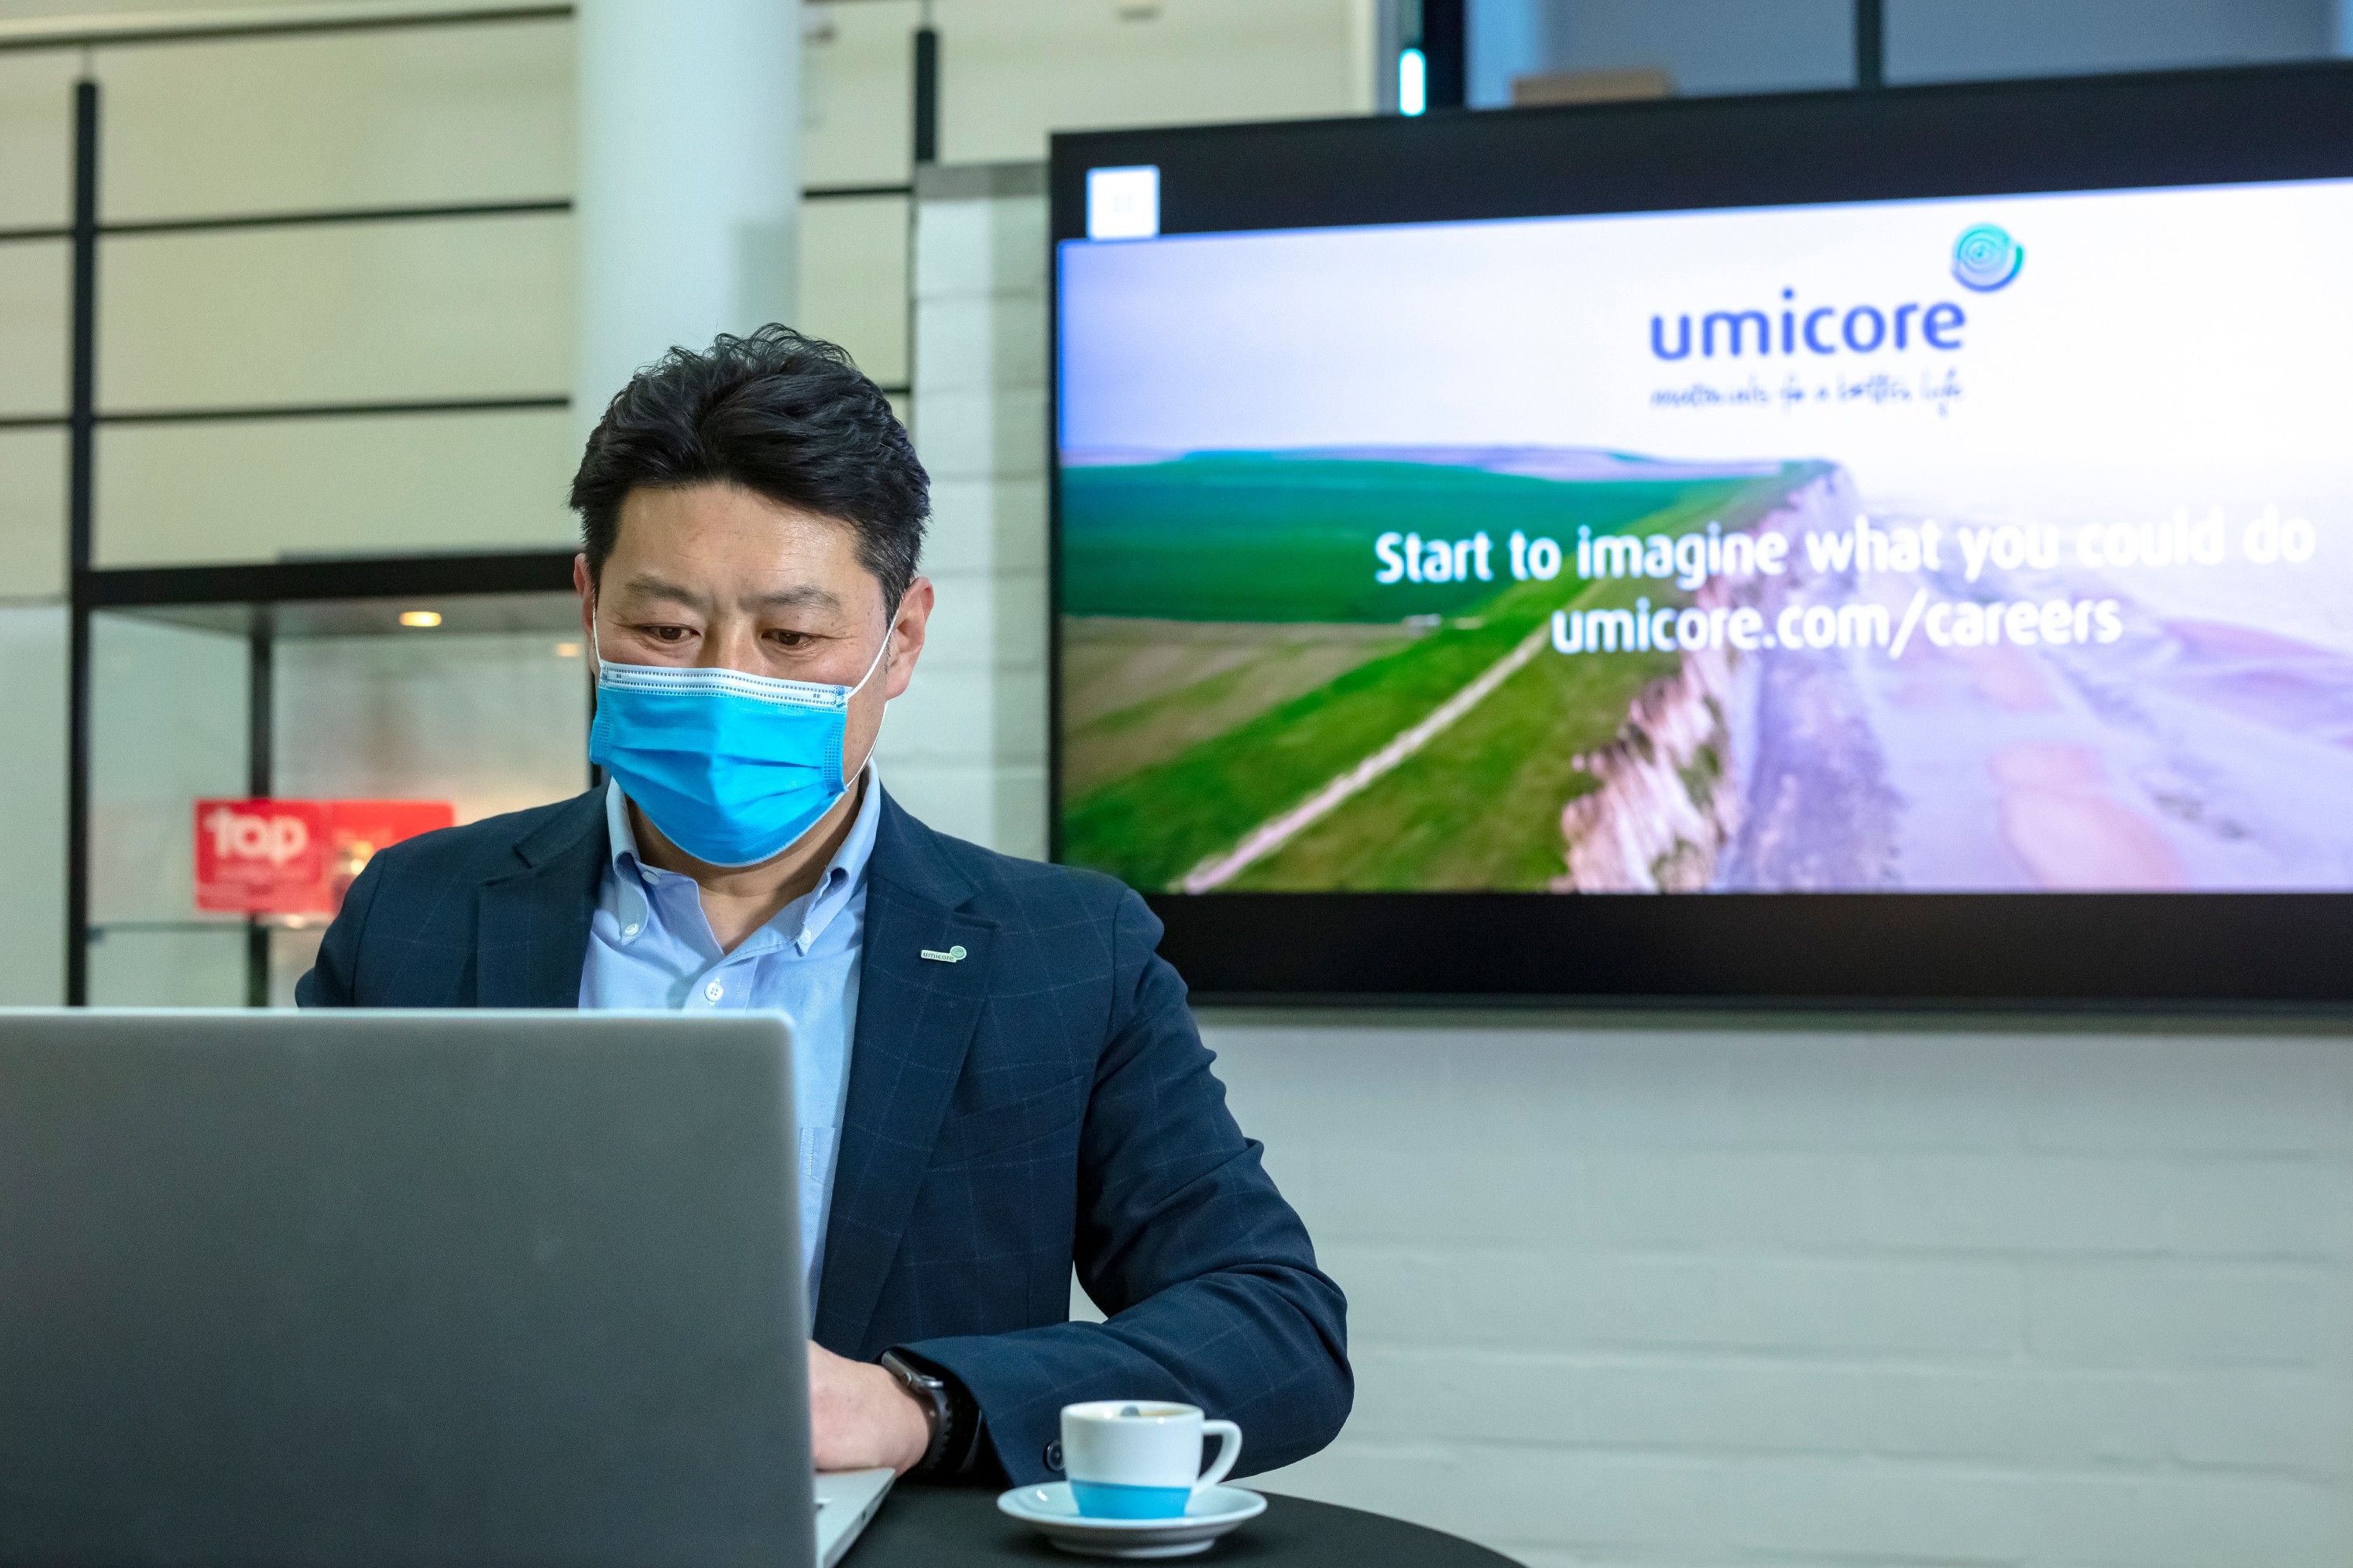
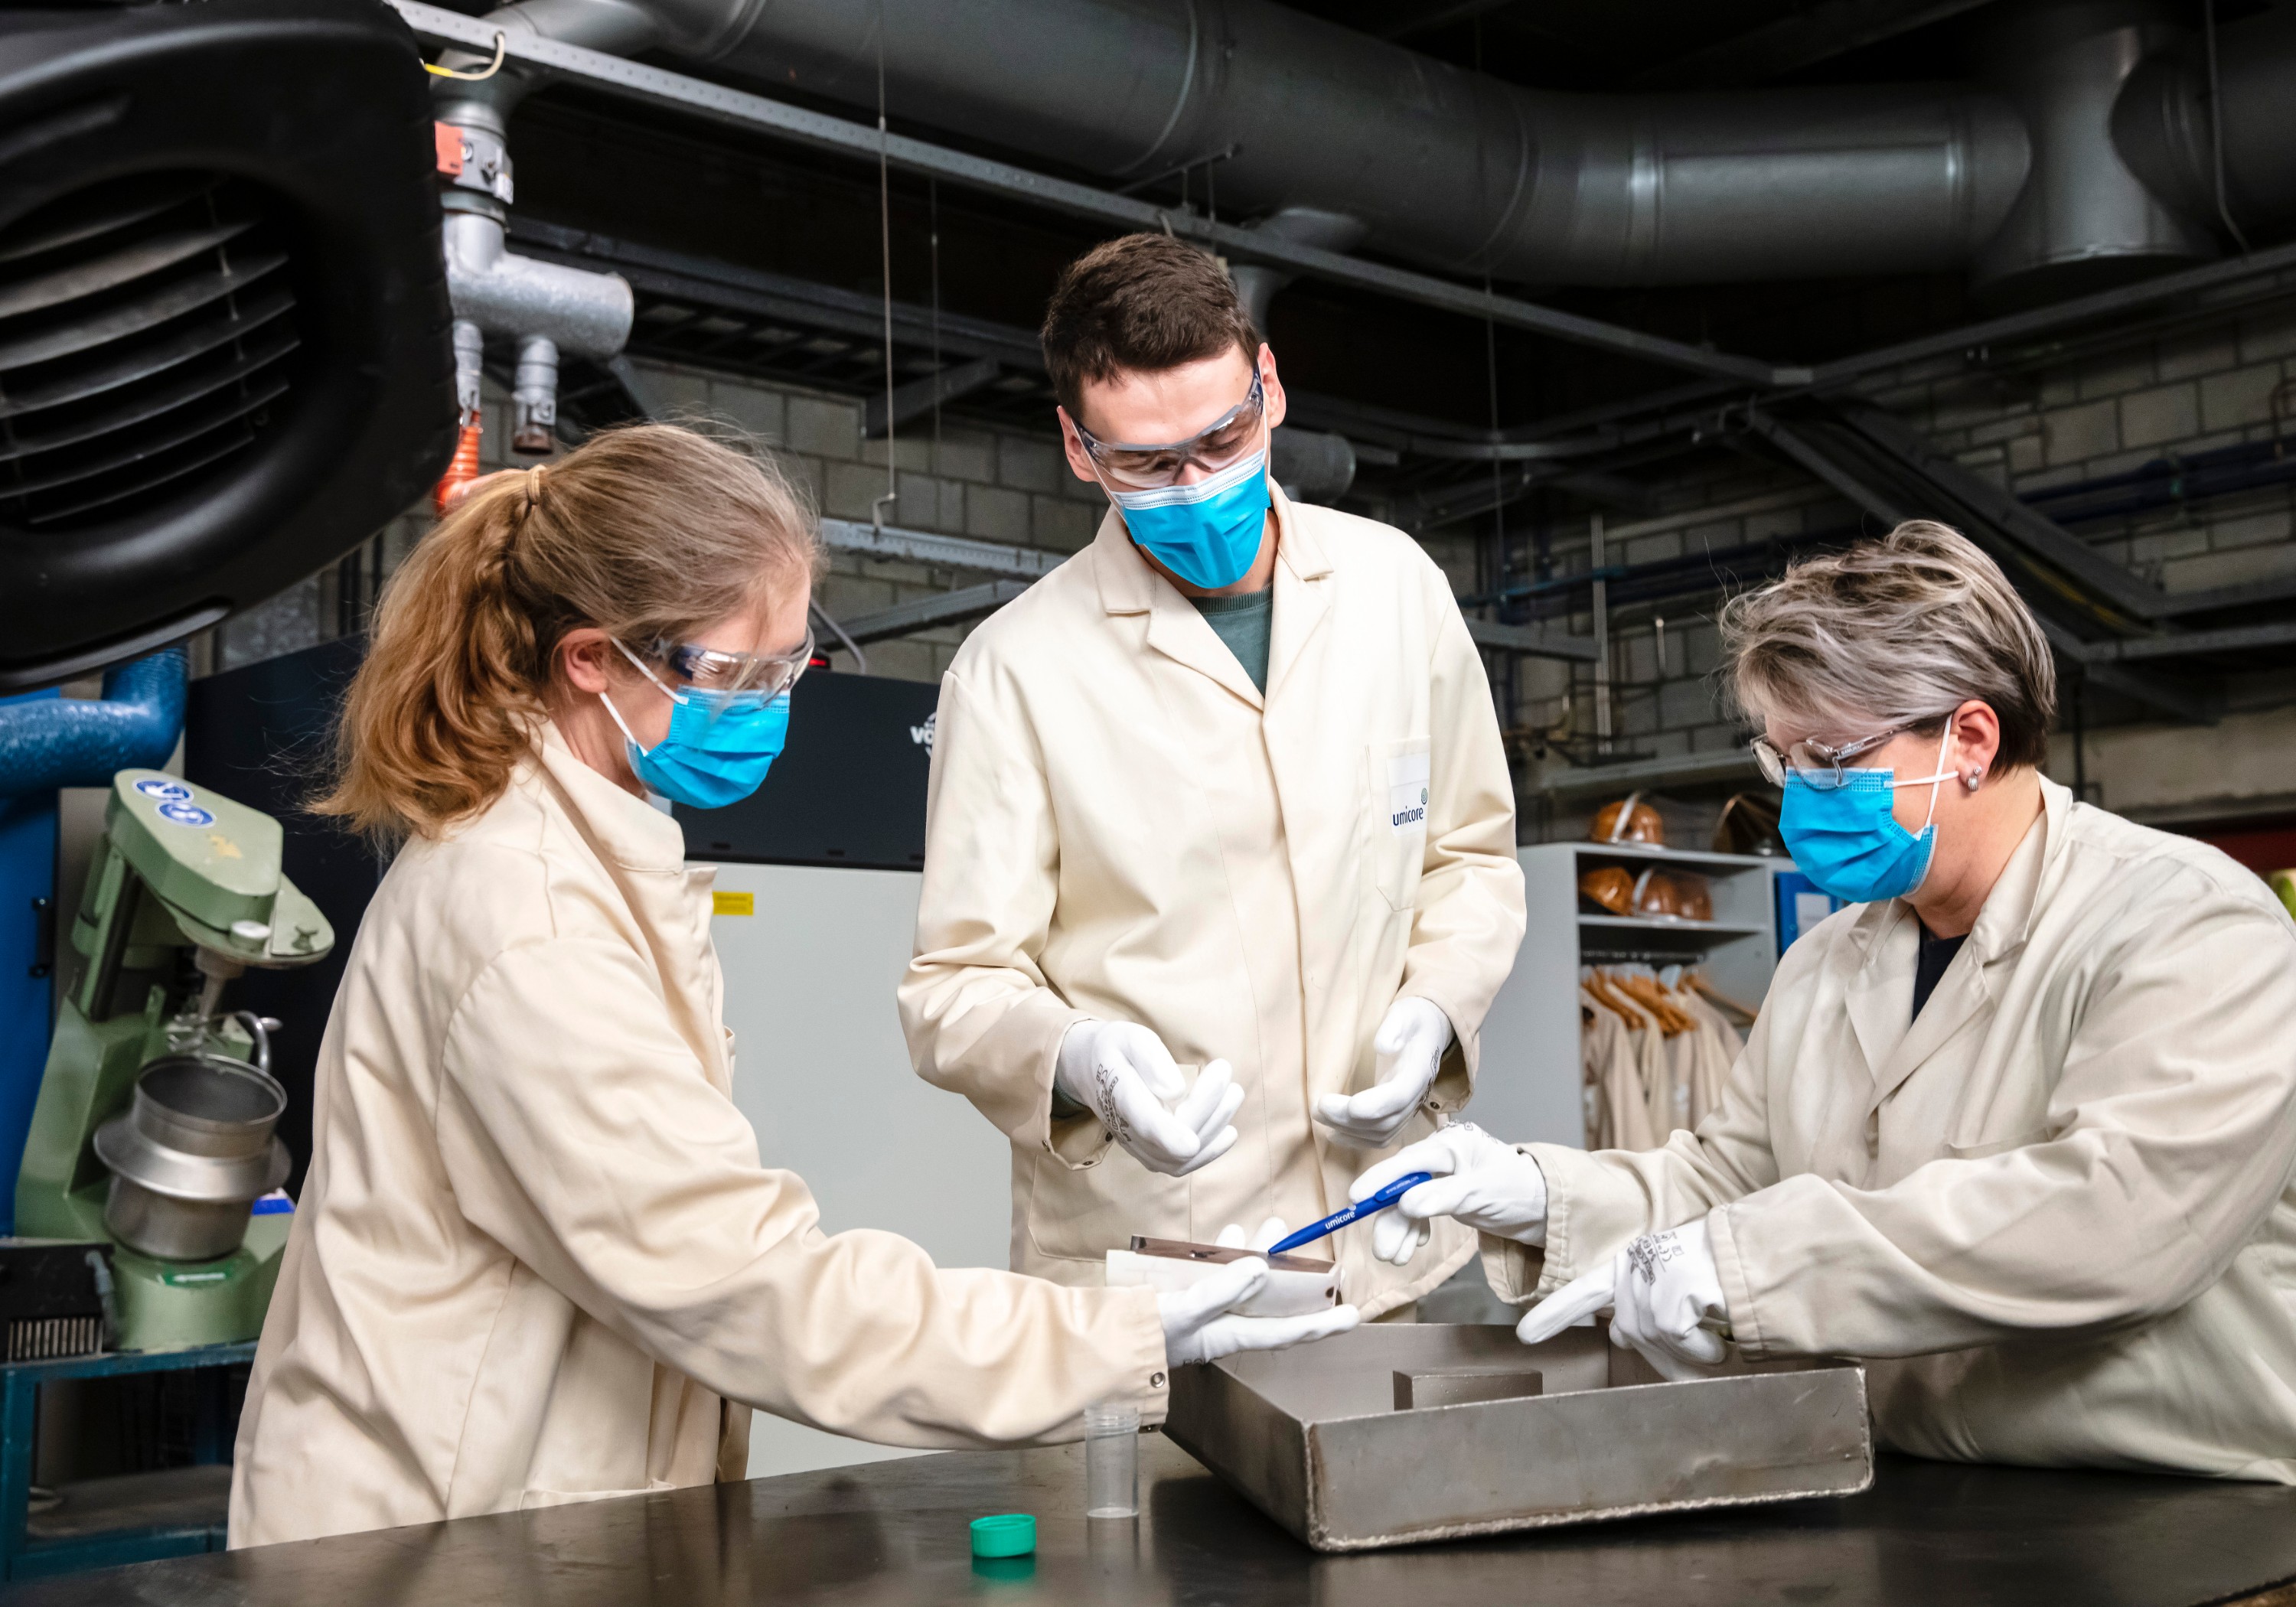
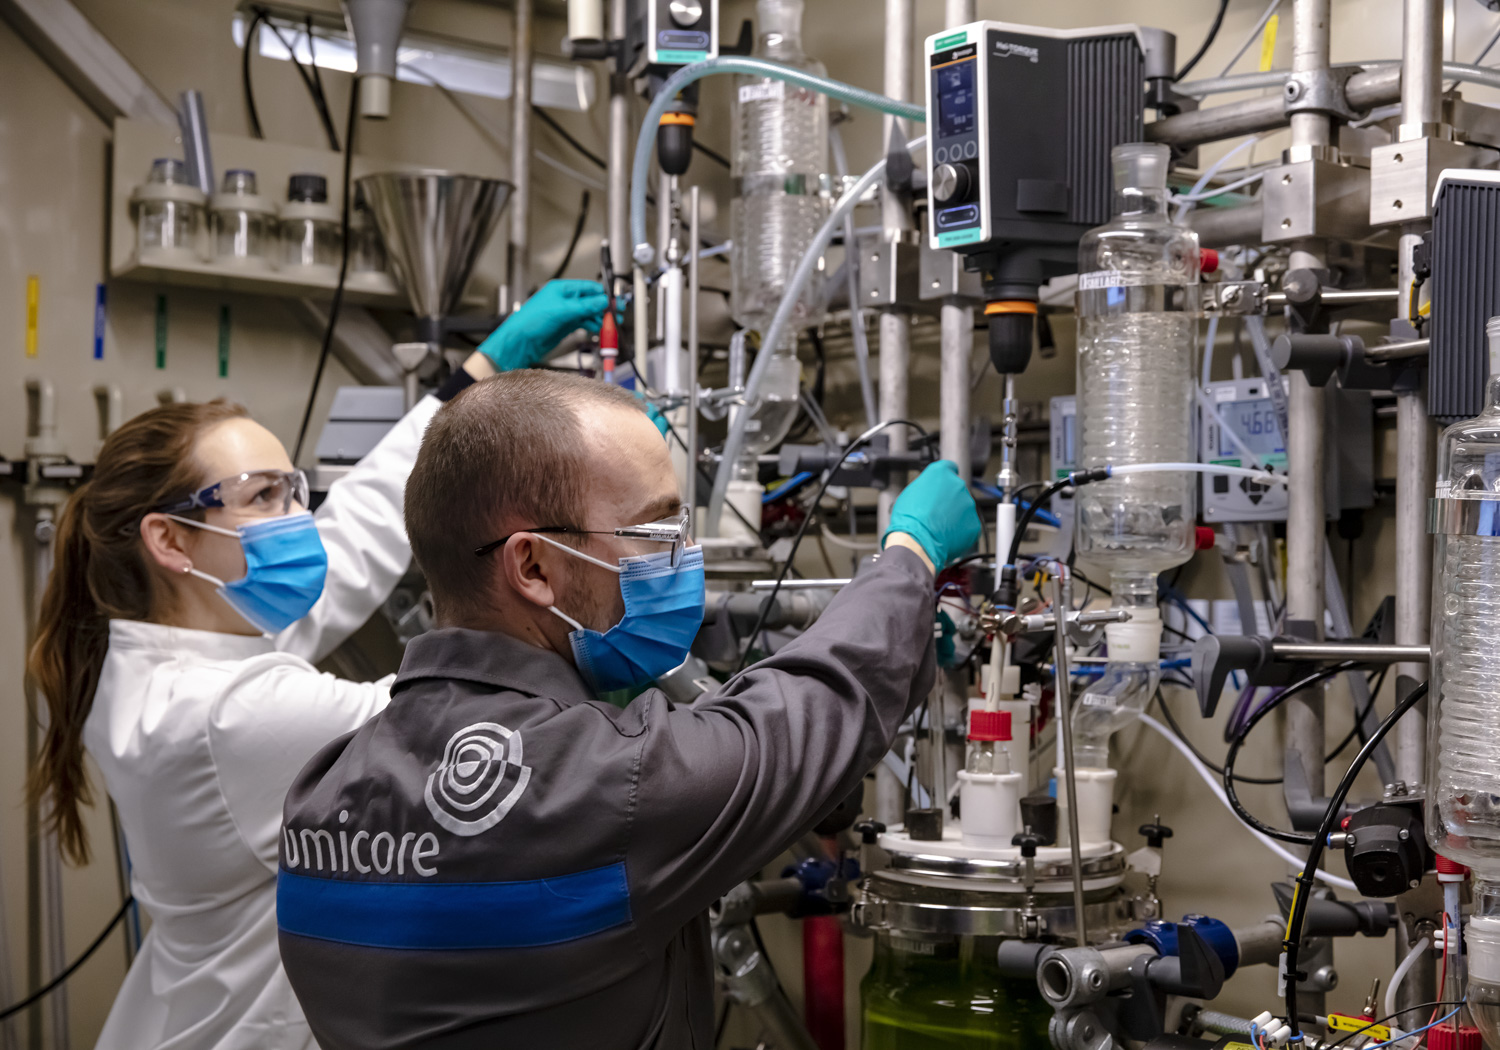
Umicore's response to Covid-19
Within only a few weeks after COVID-19 first broke out in China, the pandemic had spread around the globe, making its way to even the most remote communities. It was soon clear that COVID-19 was more than just a seasonal flu and that the consequences could potentially be serious. By the time COVID-19 had reached pandemic proportions, Umicore was already taking far-reaching measures to protect its employees and ensure continuity of production, at a time when it was impossible to predict exactly how the pandemic would progress.
Record results
Despite the severe disruption brought by the COVID-19 pandemic in its end-markets, Umicore posted its strongest financial performance ever, boosted by an exceptional PGM price environment. This underscores Umicore’s resilience and the merits of its strategy building on the complementarity of its activities.
Discover the stories behind our success
Discover more about Umicore's performance
(in million € unless stated otherwise) | 2016 | 2017 | 2018 | 2019 | 2020 |
|---|---|---|---|---|---|
Economic performance | |||||
Revenues (excluding metal) | 2,667.5 | 2,915.6 | 3,271 | 3,361 | 3,239 |
Adjusted EBIT | 350.7 | 410.3 | 514 | 509 | 804 |
Return on Capital Employed (ROCE) (in %) | 14.6 | 15.1 | 15.4 | 12.6 | 12.1 |
R&D expenditure | 155.9 | 175.2 | 196 | 211 | 223 |
Capital expenditure | 287.3 | 365.3 | 478 | 553 | 403 |
Adjusted EPS (in €/share) | 1.07 | 1.22 | 1.36 | 1.30 | 1.34 |
Gross dividend (in €/share) | 0.65 | 0.70 | 0.75 | 0.375 | 0.75 |
Social and environmental performance | |||||
Revenues from clean mobility and recycling (in%) | 65 | 67 | 72 | 75 | 77 |
Total donations, including staff freed time (in thousands of euro) | 1,290 | 1,299 | 1,432 | 1,614 | 1,467 |
CO2e emissions (scope1+2) - Market based (in tonne) | 662,059 | 633,704 | 767,702 | 791,816 | 732,543 |
CO2e emissions (scope1+2) - Location based (in tonne) | 735,065 | 663,307 | 785,789 | 815,175 | 747,964 |
Energy consumption (in terajoules) | 6,737 | 6,532 | 7,458 | 7,476 | 7,591 |
Workforce (fully consolidated companies) | 9,921 | 9,769 | 10,420 | 11,152 | 10,859 |
Lost Time Accidents (LTA) | 59 | 51 | 61 | 90 | 49 |
LTA frequency rate | 3.34 | 3.01 | 3.36 | 4.60 | 2.50 |
LTA severity rate | 0.56 | 0.09 | 0.10 | 0.20 | 0.47 |
Exposure ratio 'all biomarkers aggregated' (in %) | 3.2 | 2.7 | 2.8 | 1.8 | 1.60 |
Average number of training hours per employee | 41.49 | 45.33 | 43.10 | 48.73 | 36.33 |
Voluntary leavers ratio | 4.10 | 5.03 | 7.18 | 5.99 | 4.20 |


 Belgium
 Germany
 Worldwide